Continuous Glucose Monitoring for Non-Diabetics: What Your Numbers Really Mean
A CGM gives a metabolically healthy person more glucose data in two weeks than a lifetime of annual checkups. Here is how to read it — ranges, variability, confounders — without turning useful signal into anxiety.
Educational content — not medical advice. This article is informational only and does not replace personalized care from a qualified healthcare professional. Read our full medical disclaimer.
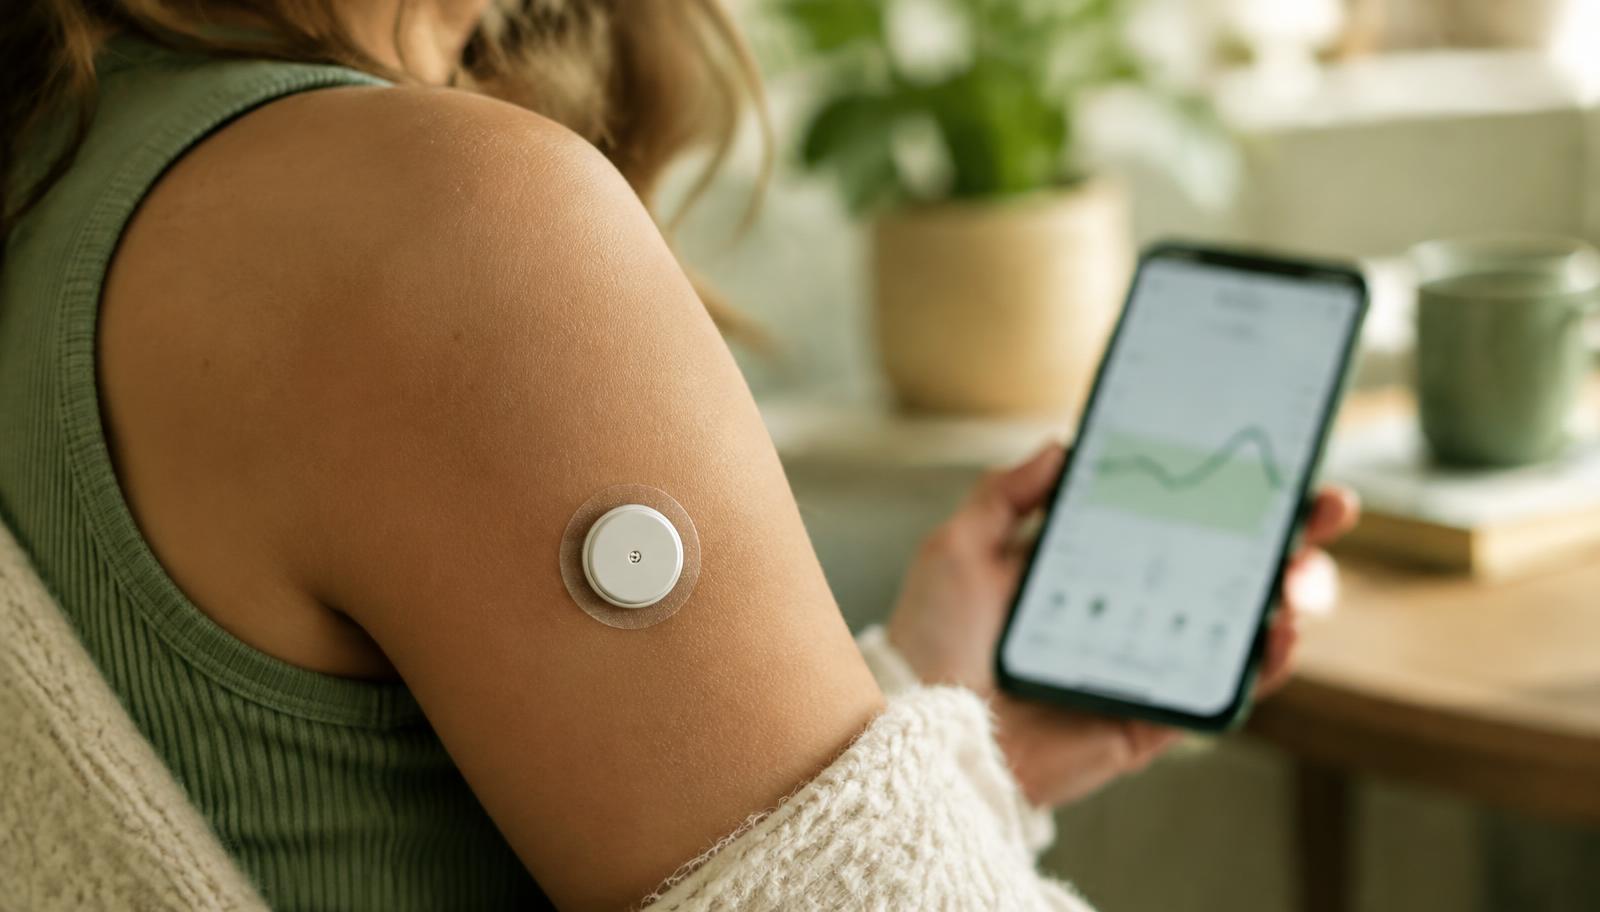
A continuous glucose monitor is a small sensor worn on the arm that samples interstitial fluid every few minutes and streams an estimated glucose value to your phone. It was built for people with diabetes, where it is a genuine clinical advance. Over the last several years it has moved into the hands of people with entirely normal glucose, who want to see what their metabolism is doing between annual blood draws.
That use case is legitimate and also easy to get wrong. A CGM does not come with a reference frame for a non-diabetic wearer, and the diabetes-derived thresholds built into most apps are not the right ones. This article covers what the data actually means when your metabolism is healthy.
Why metabolically healthy people wear one
A standard annual panel measures fasting glucose and often HbA1c. Both are useful and both are lagging, averaged indicators. Fasting glucose is a single point taken in an artificial state. HbA1c reflects an average over roughly three months and can be normal while post-meal excursions are substantial.
Insulin resistance typically develops over years. In the early phase, the pancreas compensates: it secretes more insulin to hold glucose in a normal range. Fasting glucose stays fine. HbA1c stays fine. What can shift earlier is the size and duration of post-meal glucose excursions — the body is still winning, but working harder to do it.
A CGM makes that period visible. It shows the response to particular meals, the effect of a bad night's sleep, and how a walk after dinner changes the curve. That is information no annual test provides, and it arrives while there is plenty of room to act. Our overview of continuous glucose monitoring covers the device mechanics; this article is about interpretation.
What "normal" actually looks like without diabetes
Published data from CGM studies in people without diabetes give a reasonably consistent picture, with the caveat that thresholds vary between sources and none of them are formal clinical cutoffs for non-diabetic wearers.
- Fasting and overnight glucose typically sits in the roughly 70 to 90 mg/dL band (about 3.9 to 5.0 mmol/L), fairly flat through the night.
- Most of the 24-hour period is spent in a narrow range. In healthy adults the large majority of readings tend to fall between about 70 and 120 mg/dL.
- Post-meal peaks commonly land somewhere below roughly 140 mg/dL (7.8 mmol/L) and return toward baseline within two to three hours. A brief peak above that after a large, carbohydrate-dense meal is not by itself abnormal.
- Mean glucose across a full day in healthy adults generally sits around the high 90s to low 100s mg/dL.
What tends to be more informative than any single threshold is the shape of the curve: how high, how fast, how long, and how cleanly it returns to baseline. A peak of 135 that resolves in 90 minutes is a different physiological picture than a peak of 135 that is still elevated three hours later.
Signals worth a conversation with a clinician
None of the following diagnoses anything. They are patterns that, if persistent across many days, may be worth reviewing with a physician alongside proper laboratory testing.
- Fasting or overnight values consistently running in the higher range rather than occasionally.
- Post-meal peaks that routinely exceed roughly 140 to 160 mg/dL after ordinary, non-extreme meals.
- Excursions that take more than three hours to return toward baseline.
- A steadily rising overnight baseline across weeks, not just one bad night.
- Wide day-to-day swings that do not correspond to anything you changed.
The appropriate next step is never self-diagnosis from sensor data. It is a conversation, and usually confirmatory testing — a fasting insulin, HbA1c, and a calculated insulin resistance index give a far more interpretable picture than a two-week glucose trace on its own.
Everything that moves the line besides food
New CGM wearers almost always attribute every movement to the last thing they ate. Much of the variance is not dietary.
Sleep is the largest non-dietary confounder for most people. A single short or fragmented night is associated with higher glucose responses to identical meals the following day, mediated by reduced insulin sensitivity and elevated cortisol.
Acute stress raises glucose directly. A difficult meeting, an argument or a deadline can produce a visible rise with no food involved, because stress hormones mobilize stored glucose. Many wearers see this and assume the sensor is malfunctioning.
Exercise cuts both ways. Moderate aerobic activity typically lowers glucose during and after. Hard interval training or heavy resistance work often raises it transiently, because the body is releasing glucose to fuel the effort. A post-workout spike after sprints is a normal physiological response, not a metabolic problem.
Other real influences include illness and inflammation, menstrual cycle phase, caffeine on an empty stomach, dehydration, and sensor factors themselves — compression lows from sleeping on the sensor, the first 24 hours of a new sensor's calibration period, and the inherent lag of interstitial fluid behind blood glucose, which runs roughly five to fifteen minutes.
Variability versus average
Two people can have identical average glucose and completely different curves. One spends the day in a narrow band; the other oscillates between low-70s troughs and 160 peaks. Average alone cannot distinguish them.
Glycemic variability describes the size and frequency of those swings, usually reported as standard deviation or coefficient of variation. In diabetes research, high variability is associated with outcomes independent of average glucose, and there is mechanistic interest in whether repeated large oscillations contribute to oxidative stress and endothelial strain — though the evidence base in people without diabetes is thinner and largely observational.
Practically, the useful reading is: a flatter, more stable curve at a reasonable average is the pattern most consistently associated with metabolic health. Chasing a lower average by skipping meals, while producing bigger swings when you do eat, is not an improvement.
The levers that tend to flatten curves are well established: prioritizing protein and fiber, eating carbohydrates alongside fat and protein rather than alone, a 10 to 20 minute walk after larger meals, adequate sleep, and consistent meal timing. Our article on sugar and inflammation covers the mechanistic background in more detail.
Reading spikes without spiraling
The most common failure mode of CGM use in healthy people is not misreading the physiology. It is the psychology. Real-time numbers attached to a health outcome invite constant monitoring, and constant monitoring invites anxiety.
A few guardrails help.
- A post-meal rise is supposed to happen. Glucose rising after carbohydrates is normal function, not a malfunction. What matters is magnitude and return, not the existence of a peak.
- Look at multi-day patterns, not individual readings. One high curve after one meal tells you close to nothing. The same meal producing the same curve four times tells you something.
- Test deliberately. Change one variable — walk after dinner, add protein first, sleep a full night — and compare like with like.
- Set a time limit. Two to four weeks is usually enough to learn your patterns. Indefinite wear tends to produce diminishing information and increasing rumination.
- If tracking is increasing food anxiety or driving restriction, stop, and discuss it with a clinician. That outcome is not a fair trade for the data. Anyone with a history of disordered eating should approach CGM only with professional support.
Where it fits in a longevity protocol
Glucose data is one input into metabolic health, not the whole picture. Interpreted alongside fasting insulin, HbA1c, a lipid panel including ApoB, waist circumference, blood pressure and cardiorespiratory fitness, it can help localize where an issue is developing and whether a change is working.
Our approach treats a CGM period as a diagnostic window rather than a permanent accessory: wear it, learn how your particular physiology responds to your actual meals and habits, make two or three durable changes, and revisit months later to check that they held. That is a very different use of the tool than wearing it continuously and optimizing every reading.
For readers who want to understand how glucose data integrates with a broader systems workup, our piece on functional medicine covers the wider framework.
This article is educational and does not constitute medical advice. Glucose patterns should be interpreted with a qualified clinician, particularly before making significant dietary changes or drawing conclusions about metabolic risk.